Activity 2 - Displaying RGB Color Values for Images
View Images from the Samples
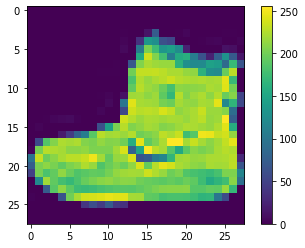
We will now view the image of a shoe from our collection of clothing samples using the code snippet below.
Go ahead and copy the following code into your Google Colab notebook:
plt.figure()
plt.imshow(train_images[0]) #Shows the first image in the data set as a plot or different colored pixels
plt.colorbar() #displays the color bar on the right
plt.grid(False)
plt.show() #displays the entire plot
Notice that the image generated has a color bar on the left. This metric is showing that the shoe uses pixel values from 0 to 255. What are pixel values?
Pixels are the smallest unit of a graphic (image or display) that a screen can represent. Think of your computer screen! There are millions of tiny colored dots that when combined can create a picture of a boat or the text shown on your screen.
The color bar shows the range in the color intensity that a pixel can display.

Question 1:
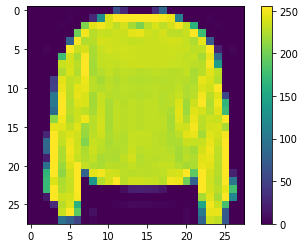
After analyzing the shoe, we want to view another item from the clothing sample. Can you figure out how to do that using the previous code block?
Use the code in the previous code block. Then change the value of the index in train_images[x] to get a new image of an item.
For example, if you input the index value as 7, you get the following item:

Normalize Pixel Values:
The program we’re going to write takes an input of values between 0 and 1. However, our pixel values are mostly all greater than 1! In fact, the range of values is 0 through 255. How can we change the range of numbers such that it can be inputted into our program?
We will use a process called “normalization”, where we transform these values to make them fit in the range of 0 to 1. More specifically, we will take all of our data and divide it by a singular value so that the range of values can now fit within 0 and 1.
Question 2:
Can you take a guess of what number we will be dividing our values by to normalize the range?
If this is confusing, think of percentages. If you have a test that is graded out of 255 total points and you get 240 points correct on the test, you will divide 240 by 255 in order to get the percent you got correct. We are doing a similar process here.
Copy and paste the following code block into your Google Colab Notebook:
#the train_images and test_images range between values from 0 to 255.
#To maintain consistency between the training and testing set, we will divide train_images and test_images by 255

train_images = train_images / 255.0

test_images = test_images / 255.0
